
Screen first › Yellow flags
Yellow flags: what predicts slow recovery
The psychological and social factors linked with persistent pain and disability in musculoskeletal conditions, how strong the evidence is, and how well the screening questionnaires work.
Red flags point to serious disease. Yellow flags point to a higher chance that pain and disability will last, whatever the structural diagnosis. Open any heading for the full evidence and sources.
Prognosis, not diagnosis. A yellow flag raises the chance of a poorer outcome in a group of patients; it does not tell you what is wrong, and it does not decide the outcome for the person in front of you. Referral pathways differ between health services and countries, and local protocols and current guidelines take precedence over this summary.
At a glance
- What they are: psychological and social factors that increase the risk of long-term disability and work loss.1 They point to prognosis, not a diagnosis.
- The original four (New Zealand, 1997): believing pain is harmful, fear-avoidance and doing less, low mood and withdrawal, and expecting passive treatment to help.1
- Best supported across body regions: widespread pain, somatisation and high disability (strong evidence); high pain intensity, long pain duration, and depression or anxiety (moderate).8
- In low back pain, no single first-visit finding shifts the odds more than a little on its own.4
- Screening questionnaires: in recent-onset low back pain, they are better at predicting disability and time off work than ongoing pain.23
The 10 main yellow flagsTen factors, from fear-avoidance to poor sleep. Open one for the evidence behind it.
Most of this research is in low back pain, so most rows below come from back pain studies. Where a factor has been shown across two or more body regions, the row says so. An odds ratio compares the odds of a poor outcome in people with the factor with the odds in people without it: 1 means no difference, and 2 means double the odds.
Fear-avoidance beliefsPredicts work outcomes most clearly in subacute back pain, mostly not in very early or chronic pain; low fear points a little towards recovery.
The belief that movement or work will cause harm, so activity is avoided. In a systematic review of 21 studies, the most convincing evidence was for work outcomes (not returning to work, sick days) in subacute low back pain (4 weeks to 3 months); in very acute pain (under 2 weeks) and chronic pain (over 3 months) fear-avoidance beliefs were mostly not predictive. In one review, a low level of fear-avoidance was among the most useful findings for predicting recovery at 1 year.3,4
Pain catastrophisingSome evidence that it slows recovery from back pain, though reviews disagree on how strong the link is.
Expecting the worst, and feeling helpless about the pain. A systematic review (16 studies) found some evidence that catastrophising may delay recovery: most studies of self-reported outcomes found it associated with pain and disability at follow-up, in acute, subacute and chronic low back pain. An earlier review found only weak support. High levels of maladaptive pain coping behaviours were among the most useful predictors of persistent disabling low back pain.4,5,6
Low mood, distress and depressionLinked with worse outcomes in 8 of 13 back pain cohorts, with moderate evidence across other body regions too.
Psychological distress and depressive mood were the main findings of a 2002 systematic review of psychological predictors in low back pain (with somatisation to a lesser extent). In acute and subacute low back pain, 8 of 13 cohorts found that symptoms of depression were related to worse outcomes (odds ratios 1.04 to 2.47). Across musculoskeletal pain in primary care, high depression or anxiety scores had moderate evidence as a factor common to two or more body regions.6,7,8
Low expectation of recoveryPeople who expect to recover tend to do better, in back pain, shoulder pain and most studies across other conditions.
In acute and subacute low back pain, recovery expectations measured with a specific, time-based single question strongly predicted work outcome, and expectations measured within the first 3 weeks strongly predicted outcome. Recovery expectations remained important after 6 weeks off work. In shoulder pain referred to physiotherapy, expecting ‘complete recovery’ rather than ‘slight improvement’ was linked with better outcomes at 6 weeks and 6 months. A review across many health conditions found that 15 of 16 moderate-quality studies linked positive expectations with better outcomes.9,10,11,12
Low pain self-efficacyLinked with poorer shoulder outcomes in one large study; the wider chronic shoulder evidence points the same way but is very low quality.
Low confidence in being able to carry on with activities despite pain. In 1,030 people with shoulder pain, higher pain self-efficacy was linked with better outcomes at 6 weeks and 6 months. A review of chronic shoulder pain found the same direction, from very low quality evidence.11,13
Somatisation and widespread painAmong the best-supported predictors of a poorer outcome across body regions, with strong evidence in primary care musculoskeletal pain.
Across musculoskeletal pain in primary care, widespread pain and somatisation had strong evidence as factors common to two or more body regions. Somatisation also emerged, to a lesser extent than distress, in the low back pain review.6,8
Passive copingOne of the original guide's four key factors, but research support for it across musculoskeletal pain is weak.
Relying on rest, and expecting passive treatment rather than active participation to help. Expecting passive treatment is one of the New Zealand guide’s four key factors. Across musculoskeletal pain, poor coping strategies had weak evidence as a common factor.1,8
Work factorsMostly weaker predictors, though physical work demands and work-related fear are linked with poorer work outcomes in subacute and longer-lasting back pain.
In low back pain, factors in the work environment were less useful predictors (likelihood ratio about 1.5) than the strongest findings, such as maladaptive pain coping (2.5). In workers off work for more than 6 weeks, physical demands at work remained important. High scores on the work scale of the Fear-Avoidance Beliefs Questionnaire were linked with poorer work outcomes in subacute back pain.3,4,10
Compensation and legal claimsLinked with poorer results after surgery and with lasting whiplash symptoms, but the evidence is observational, so cause and effect is uncertain.
In a meta-analysis of 129 surgical studies (20,498 patients), patients receiving compensation had higher odds of an unsatisfactory outcome after surgery (odds ratio 3.79). The authors note the data are observational and should be interpreted with caution. After whiplash injury, compensation and legal factors were among the factors linked with continuing pain and disability.14,15
Poor sleepPoor sleep is linked with back pain that does not improve, but the evidence is low to very low quality.
In low back pain, poor sleep at the start was moderately associated with not improving in the long to very long term (odds ratio 1.55, 3 studies, unadjusted), and sleep that did not improve was linked with low back pain that did not improve in the short to moderate term. The authors rate the evidence as low to very low quality.16
How much they shift the odds (low back pain)No single first-visit finding strongly predicts disability at 1 year; the best shift the chance only a little, in either direction.
One systematic review (20 studies, 10,842 patients with low back pain of less than 8 weeks) calculated likelihood ratios for predicting persistent disabling low back pain at 1 year.4 These are the same kind of figure as the special tests in this library. A likelihood ratio above 1 raises the chance of a poor outcome; below 1 lowers it. Values above about 5 or below about 0.2 make a real difference; values between 2 and 5, or between 0.2 and 0.5, make a small difference; values between 0.5 and 2 barely change the chance (see the glossary).36 By those cut-offs, none of the median values below shifts the chance much on its own.
| Finding at the first visit | Likelihood ratio (median, with the range across studies) and what it does |
|---|---|
| Non-organic signs | Likelihood ratio 3.0 (range 1.7 to 4.6). Raises the chance of a poor outcome a little. |
| High levels of maladaptive pain coping | Likelihood ratio 2.5 (range 2.2 to 2.8). Raises the chance of a poor outcome a little. |
| Psychiatric comorbidity | Likelihood ratio 2.2 (range 1.9 to 2.3). Raises the chance of a poor outcome a little. |
| High baseline functional impairment | Likelihood ratio 2.1 (range 1.2 to 2.7). Raises the chance of a poor outcome a little. |
| Low general health status | Likelihood ratio 1.8 (range 1.1 to 2.0). Barely changes the chance. |
| Work environment, baseline pain, radiculopathy | Likelihood ratio about 1.5. Barely changes the chance. |
| Previous episodes, demographic factors | Likelihood ratio about 1.0. Makes no difference to the chance. |
| Low fear-avoidance | Likelihood ratio 0.39 (range 0.38 to 0.40). Lowers the chance of a poor outcome a little, so it points towards recovery. |
| Low baseline functional impairment | Likelihood ratio 0.40 (range 0.10 to 0.52). Lowers the chance of a poor outcome a little, so it points towards recovery. |
Results were similar for outcomes at 3 to 6 months. The review also found several risk prediction instruments useful, but none was extensively validated.4 Abstract source only.
By body region and settingMost of the evidence is in low back pain; neck, shoulder, knee replacement, sport, surgery and musculoskeletal pain in general are covered too.
Low backThe most studied region; several yellow flags modestly predict outcome, with fear-avoidance mattering most in the subacute stage.
The most studied region; see the 10 main yellow flags and how much they shift the odds. Fear-avoidance beliefs matter most in the subacute stage (4 weeks to 3 months).3–9
Neck after whiplashPain and injury factors predict most; anxiety, catastrophising and claims are also linked, though catastrophising did not hold up after checks for publication bias.
A meta-analysis found 12 significant predictors of poor outcome after whiplash. High catastrophising was the clearly psychological one; most of the others were pain, disability, headache, injury grade and other non-psychological factors. Catastrophising was not among the predictors that held up after allowing for publication bias. A review of 12 systematic reviews found post-injury anxiety, catastrophising, and compensation and legal factors linked with continuing pain and disability, and MRI or X-ray findings not linked.15,17
Neck pain without injuryVery little, low-quality evidence; the factors found are mostly not psychological and mostly cannot be changed.
A review found only 6 studies, all at high risk of bias, after a first episode of non-traumatic neck pain. The factors with moderate evidence were age over 40, back pain at the same time, a previous episode of neck pain and headache; few factors were modifiable, and the evidence was low to very low quality.18
ShoulderExpectation of recovery and confidence predicted outcome where structural findings did not, though the chronic shoulder evidence is very low quality.
In 1,030 people referred to physiotherapy, patient expectation of recovery and pain self-efficacy were consistently linked with outcome, while examination findings pointing to a specific structural diagnosis were not. In chronic shoulder pain (27 studies, 11,176 people), distress, depression, anxiety, fear-avoidance, somatisation and catastrophising were linked with more pain and disability, and self-efficacy, resilience and expectation of recovery with less, from very low quality evidence.11,13
Knee replacementCatastrophising, poorer mental health, and pain before surgery and elsewhere were the strongest predictors of lasting pain after knee replacement.
In a meta-analysis of 32 studies (almost 30,000 patients), catastrophising, mental health, knee pain before surgery and pain elsewhere were the strongest independent predictors of persistent pain after total knee replacement.19
Return to sport after injury and ACL reconstructionConfidence, motivation and low fear are linked with getting back to the previous level of sport, and sooner.
In 11 studies (983 athletes), motivation, confidence and low fear were associated with a greater likelihood of returning to the pre-injury level and returning sooner; fear was a prominent emotion at the time of return. After ACL reconstruction (69 articles, 7,556 people), 81% returned to any sport, 65% to their pre-injury level and 55% to competitive sport; a positive psychological response favoured returning to the pre-injury level.20,21
Lumbar surgery and spinal cord stimulationAlmost all studies (92%) found a psychological factor linked with poorer results, but there is not enough evidence that screening before surgery helps.
In 25 studies, 92.0% found at least one psychological factor linked with poor outcome; somatisation, depression, anxiety and poor coping were the most useful predictors. The authors found insufficient evidence that screening before surgery improves outcomes.22
Any surgery with a compensation claimCompensated patients had about 3.8 times the odds of an unsatisfactory surgical result, but the data are observational, so cause is uncertain.
Odds ratio 3.79 for an unsatisfactory outcome in compensated patients (129 studies); observational data.14
Musculoskeletal pain in generalWidespread pain, somatisation and high disability are the best-supported predictors across regions, though most of the evidence comes from back pain.
In 78 primary care studies (more than 48,000 people), the factors common to two or more body regions were widespread pain, high functional disability and somatisation (strong evidence), high pain intensity, long pain duration and high depression or anxiety scores (moderate evidence), and previous pain episodes, poor coping and movement restriction (weak evidence). Most studies were of back pain; only 3 were of knee pain and 3 of hip pain.8
Other regionsThis page does not yet cover these regions, because no review meeting its standard was found.
For the elbow, wrist and hand, hip, and ankle and foot, we did not find reviews of yellow flags that met the standard of this page, so they are not covered yet.
Screening questionnaires and how well they predictIn recent-onset back pain, better at predicting disability and time off work than ongoing pain.
These questionnaires predict an outcome months later, so their accuracy is usually reported as an area under the curve (AUC) rather than sensitivity and specificity. In plain terms: take one person who goes on to do poorly and one who recovers. The AUC is the chance that the questionnaire gave the first person the higher-risk score. 0.5 is a coin toss; 1.0 is perfect. One review used these labels: under 0.6 uninformative, 0.6 to 0.7 poor, 0.7 to 0.8 acceptable, 0.8 to 0.9 excellent, above 0.9 outstanding.23
Keele STarT Back ToolAcceptable at predicting future back disability, but not informative for ongoing pain, and results vary between studies.
9 items: referred leg pain, pain elsewhere, disability (2 items), bothersomeness, catastrophising, fear, anxiety and depression; the last 5 form a psychosocial subscale. Low risk = total 0 to 3; high risk = 4 or 5 on the psychosocial subscale; the rest medium risk. Developed in UK primary care adults with non-specific back pain (development sample 131, external sample 500). Pooled across studies of recent-onset low back pain: AUC 0.74 (95% confidence interval 0.66 to 0.82; brackets after each AUC are 95% confidence intervals) for a poor disability outcome (3 studies, 821 people, with substantial variation between studies), ‘acceptable’; AUC 0.59 (0.55 to 0.63) for persistent pain (5 studies, 1,153 people), ‘non-informative’. In 290 Western Australians with chronic low back pain, it gave an acceptable indication of 1-year disability, was poor for future pain, and could not predict global perceived change.23,24,25
Örebro Musculoskeletal Pain Screening Questionnaire (25 items)Excellent at predicting long time off work, acceptable for disability and poor for ongoing pain, in recent-onset back pain.
107 patients from seven primary care units, followed for 6 months: a cut-off of 90 points gave sensitivity 89% and specificity 65% for sickness absence (positive likelihood ratio 2.5, negative 0.17, calculated from these figures), and sensitivity 74% and specificity 79% for function (positive likelihood ratio 3.5, negative 0.33, calculated from these figures); the total score did not predict pain. Pooled across studies: AUC 0.83 (0.75 to 0.90) for prolonged absence from work at 6 months (3 studies, 243 people), ‘excellent’; 0.75 (0.69 to 0.82) for disability (512 people; the paper reports 5 studies in its text and 3 in its Table 5), ‘acceptable’; 0.69 (0.62 to 0.76) for pain (4 studies, 360 people), ‘poor’. An earlier review of spinal pain found AUCs of 0.62 to 0.75 for persisting pain and 0.68 to 0.83 for persisting disability.23,26,27
Örebro short form (10 items)Predicts sick leave nearly as well as the full version, better in primary care than occupational health, though tested in only two groups.
Two items from each of five factors. Tested in an occupational health group (324 people) and a primary care group (183 people) with musculoskeletal pain, followed for 1 year for sick leave. AUC 0.81 in primary care and 0.70 in the occupational group (the full version: 0.84 and 0.72). A cut-off of 50 picked up 83% (primary care) and 85% (occupational) of those who developed disability. Specificity is not given in the abstract.28
Keele STarT MSK ToolPredicted outcome well across several body regions in UK primary care, though less well in the trial than in the original cohort.
10 items, for back, neck, knee, shoulder or multisite pain in UK primary care (cohort 1,890; trial 524). In the cohort, AUC (c statistic) 0.839 for physical health and 0.822 for pain at 6 months; 0.73 in the trial. It placed 24.9% of the cohort at low, 41.7% at medium and 33.4% at high risk.29
Taken together: in primary care, these questionnaires are poor at telling apart who will develop chronic pain, and better at estimating the risk of disability and long time off work.23 A 2022 review of 17 prognostic models for recent-onset low back pain found that most did not discriminate well and judged it premature to advocate any of them.30 A tool works best in the kind of patients it was developed in; the STarT Back Tool performed better in UK general practice than in physiotherapy or chiropractic settings.23
What the research found about acting on yellow flagsMatching care to risk and targeting high fear-avoidance have some support; guidelines agree psychosocial factors belong in the assessment, though NICE has withdrawn its psychological therapy recommendations.
Does matching care to risk help?Risk-matched care slightly improved disability at lower cost in the first trial; later trials were mixed, largely due to delivery, a 2024 review concluded.
In the STarT Back trial (851 adults, 10 general practices in England), low-risk patients had one session of advice and education; medium-risk patients were referred to physiotherapy; high-risk patients were referred to psychologically informed physiotherapy, given by physiotherapists with 6 extra days of training. Disability improved more than with current best practice (a difference on the Roland-Morris disability questionnaire, scored 0 to 24 with higher meaning more disability, of 1.81 points at 4 months and 1.06 at 12 months), with lower mean back pain-related health-care costs per patient over 12 months (£240.01 vs £274.40). In the high-risk group the difference was 2.53 points at 4 months but 1.22 and no longer significant at 12 months; low-risk patients did no worse with one session. At least 7 trials of the approach (2011 to 2023, across four countries) have had contrasting results; a 2024 review concluded that difficulties putting stratified care into practice, more than the tool itself, largely explain the differences.24,31,32
Does targeting the flags help?Treatment aimed at yellow flags, especially high fear-avoidance, tends to do better than ignoring them, with moderate quality evidence at best.
The 2011 reappraisal found mixed results from early interventions, but concluded that targeting yellow flags, particularly when they are at high levels, seems to give more consistently positive results than ignoring them or giving everyone the same treatment. In patients with low back pain of up to 6 months and high fear-avoidance beliefs, treatments that addressed those beliefs were more effective than control treatments based on biomedical concepts (moderate quality evidence).2,33
What do guidelines say?Guidelines agree psychosocial factors belong in the assessment, but NICE has withdrawn its psychological therapy recommendations as possibly out of date.
‘Assess psychosocial factors’ is one of 11 recommendations shared by high-quality guidelines for musculoskeletal pain (11 guidelines covering low back, neck, shoulder and osteoarthritis). NICE’s low back pain guideline says to consider risk stratification, for example the STarT Back tool, at first contact for each new episode, with simpler support for those likely to recover quickly and more intensive support for those at higher risk. In July 2026 NICE removed its recommendations on psychological therapy and on combined physical and psychological programmes, because a surveillance review found they may be out of date and an update was not prioritised. The New Zealand guide recommends referral to a multidisciplinary team when the barriers to return to work are too complex to manage, and keeps specialised psychological referral for psychopathology or for people not responding to appropriate management.1,34,35
Before surgeryPsychological factors predict poorer surgical results, but screening before surgery has not been shown to help; NICE says distress should not affect sciatica surgery referral.
Psychological factors predict poorer results after lumbar surgery and spinal cord stimulation, but there is insufficient evidence that psychological screening before surgery improves outcomes. NICE’s low back pain guideline says psychological distress should not influence the decision to refer someone with sciatica for a surgical opinion.22,35
Where the term comes fromThe idea began in acute back pain, where harmful beliefs, fear-avoidance, low mood and expecting passive treatment were agreed to predict poor outcomes.
The term comes from the Guide to Assessing Psychosocial Yellow Flags in Acute Low Back Pain, written by Kendall, Linton and Main and first published in New Zealand in 1997. It was later built into the New Zealand Acute Low Back Pain Guide (October 2004 edition), which defines yellow flags as factors that increase the risk of developing or perpetuating long-term disability and work loss.1
The guide says there is good agreement that four factors consistently predict poor outcomes:1
- a belief that back pain is harmful or potentially severely disabling
- fear-avoidance behaviour and reduced activity
- a tendency to low mood and withdrawal from social interaction
- an expectation that passive treatment will help, rather than a belief that active participation will.
For a fuller clinical assessment it groups yellow flags under seven headings: attitudes and beliefs about back pain, behaviours, compensation issues, diagnosis and treatment, emotions, family, and work.1 In 2011 a reappraisal by Nicholas, Linton, Watson, Main and the ‘Decade of the Flags’ Working Group noted that it has been suggested yellow flags be confined primarily to psychological risk factors, to set them apart from other risk factors such as social and environmental ones.2
These are findings from the cited studies and guidelines, not instructions. The page is not a complete review of every prognostic factor and is not a clinical protocol. It is written for registered health practitioners and students, who remain responsible for their own clinical decisions; it is not advice for patients. See the terms of use.
Last checked against the cited sources: 12 November 2026.
Before yellow flags come red flags: Red flags by body region.
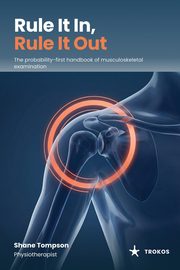
Get the book for the examination itself
Rule It In, Rule It Out works through the examination of each body region: the red flags to screen first, then the special tests, with the published figures for each test and how to read them.
Look inside the book: free sample pages
Coming November 2026: 330 pages, paperback and PDF. Launch offer: subscribers get the PDF for A$39 instead of A$49, for the first two weeks after publication. Be first to know at launch
Sources (36)Each research finding above is cited to a published source; figures checked only against an abstract are labelled abstract source only.
- Kendall NAS, Linton SJ, Main CJ. Guide to Assessing Psychosocial Yellow Flags in Acute Low Back Pain: Risk Factors for Long-Term Disability and Work Loss. 1997. Incorporated as Part 2 of: Accident Compensation Corporation and New Zealand Guidelines Group. New Zealand Acute Low Back Pain Guide. Wellington: ACC; October 2004 edition. Full document. Link
- Nicholas MK, Linton SJ, Watson PJ, Main CJ; ‘Decade of the Flags’ Working Group. Early identification and management of psychological risk factors (‘yellow flags’) in patients with low back pain: a reappraisal. Phys Ther. 2011;91(5):737-753. Abstract source only. Link
- Wertli MM, Rasmussen-Barr E, Weiser S, Bachmann LM, Brunner F. The role of fear avoidance beliefs as a prognostic factor for outcome in patients with nonspecific low back pain: a systematic review. Spine J. 2014;14(5):816-836.e4. Abstract source only. Link
- Chou R, Shekelle P. Will this patient develop persistent disabling low back pain? JAMA. 2010;303(13):1295-1302. Abstract source only. Link
- Wertli MM, Eugster R, Held U, Steurer J, Kofmehl R, Weiser S. Catastrophizing—a prognostic factor for outcome in patients with low back pain: a systematic review. Spine J. 2014;14(11):2639-2657. Abstract source only. Link
- Pincus T, Burton AK, Vogel S, Field AP. A systematic review of psychological factors as predictors of chronicity/disability in prospective cohorts of low back pain. Spine. 2002;27(5):E109-E120. Abstract source only. Link
- Pinheiro MB, Ferreira ML, Refshauge K, et al. Symptoms of depression as a prognostic factor for low back pain: a systematic review. Spine J. 2016;16(1):105-116. Abstract source only. Link
- Artus M, Campbell P, Mallen CD, Dunn KM, van der Windt DA. Generic prognostic factors for musculoskeletal pain in primary care: a systematic review. BMJ Open. 2017;7(1):e012901. Full paper. Link
- Iles RA, Davidson M, Taylor NF, O’Halloran P. Systematic review of the ability of recovery expectations to predict outcomes in non-chronic non-specific low back pain. J Occup Rehabil. 2009;19(1):25-40. Abstract source only. Link
- Steenstra IA, Munhall C, Irvin E, et al. Systematic review of prognostic factors for return to work in workers with sub acute and chronic low back pain. J Occup Rehabil. 2017;27(3):369-381. Abstract source only. Link
- Chester R, Jerosch-Herold C, Lewis J, Shepstone L. Psychological factors are associated with the outcome of physiotherapy for people with shoulder pain: a multicentre longitudinal cohort study. Br J Sports Med. 2018;52(4):269-275. Full paper. Link
- Mondloch MV, Cole DC, Frank JW. Does how you do depend on how you think you’ll do? A systematic review of the evidence for a relation between patients’ recovery expectations and health outcomes. CMAJ. 2001;165(2):174-179. Abstract source only. Link
- Martinez-Calderon J, Meeus M, Struyf F, et al. The role of psychological factors in the perpetuation of pain intensity and disability in people with chronic shoulder pain: a systematic review. BMJ Open. 2018;8(4):e020703. Abstract source only. Link
- Harris I, Mulford J, Solomon M, van Gelder JM, Young J. Association between compensation status and outcome after surgery: a meta-analysis. JAMA. 2005;293(13):1644-1652. Abstract source only. Link
- Sarrami P, Armstrong E, Naylor JM, Harris IA. Factors predicting outcome in whiplash injury: a systematic meta-review of prognostic factors. J Orthop Traumatol. 2017;18(1):9-16. Abstract source only. Link
- Silva S, Hayden JA, Mendes G, et al. Sleep as a prognostic factor in low back pain: a systematic review of prospective cohort studies and secondary analyses of randomized controlled trials. Sleep. 2024;47(5):zsae023. Abstract source only. Link
- Walton DM, MacDermid JC, Giorgianni AA, et al. Risk factors for persistent problems following acute whiplash injury: update of a systematic review and meta-analysis. J Orthop Sports Phys Ther. 2013;43(2):31-43. Abstract source only. Link
- Verwoerd M, Wittink H, Maissan F, et al. Prognostic factors for persistent pain after a first episode of nonspecific idiopathic, non-traumatic neck pain: a systematic review. Musculoskelet Sci Pract. 2019;42:13-37. Abstract source only. Link
- Lewis GN, Rice DA, McNair PJ, Kluger M. Predictors of persistent pain after total knee arthroplasty: a systematic review and meta-analysis. Br J Anaesth. 2015;114(4):551-561. Abstract source only. Link
- Ardern CL, Taylor NF, Feller JA, Webster KE. A systematic review of the psychological factors associated with returning to sport following injury. Br J Sports Med. 2013;47(17):1120-1126. Abstract source only. Link
- Ardern CL, Taylor NF, Feller JA, Webster KE. Fifty-five per cent return to competitive sport following anterior cruciate ligament reconstruction surgery: an updated systematic review and meta-analysis. Br J Sports Med. 2014;48(21):1543-1552. Abstract source only. Link
- Celestin J, Edwards RR, Jamison RN. Pretreatment psychosocial variables as predictors of outcomes following lumbar surgery and spinal cord stimulation: a systematic review and literature synthesis. Pain Med. 2009;10(4):639-653. Abstract source only. Link
- Karran EL, McAuley JH, Traeger AC, et al. Can screening instruments accurately determine poor outcome risk in adults with recent onset low back pain? A systematic review and meta-analysis. BMC Med. 2017;15:13. Full paper. Link
- Hill JC, Dunn KM, Lewis M, et al. A primary care back pain screening tool: identifying patient subgroups for initial treatment. Arthritis Rheum. 2008;59(5):632-641. Abstract source only. Link
- Kendell M, Beales D, O’Sullivan P, et al. The predictive ability of the STarT Back Tool was limited in people with chronic low back pain: a prospective cohort study. J Physiother. 2018;64(2):107-113. Abstract source only. Link
- Linton SJ, Boersma K. Early identification of patients at risk of developing a persistent back problem: the predictive validity of the Orebro Musculoskeletal Pain Questionnaire. Clin J Pain. 2003;19(2):80-86. Abstract source only. Link
- Hockings RL, McAuley JH, Maher CG. A systematic review of the predictive ability of the Orebro Musculoskeletal Pain Questionnaire. Spine. 2008;33(15):E494-E500. Abstract source only. Link
- Linton SJ, Nicholas M, MacDonald S. Development of a short form of the Örebro Musculoskeletal Pain Screening Questionnaire. Spine. 2011;36(22):1891-1895. Abstract source only. Link
- Dunn KM, Campbell P, Lewis M, et al. Refinement and validation of a tool for stratifying patients with musculoskeletal pain. Eur J Pain. 2021;25(10):2081-2093. Abstract source only. Link
- Silva FG, Costa LO, Hancock MJ, et al. No prognostic model for people with recent-onset low back pain has yet been demonstrated to be suitable for use in clinical practice: a systematic review. J Physiother. 2022;68(2):99-109. Abstract source only. Link
- Hill JC, Whitehurst DG, Lewis M, et al. Comparison of stratified primary care management for low back pain with current best practice (STarT Back): a randomised controlled trial. Lancet. 2011;378(9802):1560-1571. Full paper. Link
- Croft P, Hill JC, Foster NE, Dunn KM, van der Windt DA. Stratified health care for low back pain using the STarT Back approach: holy grail or doomed to fail? Pain. 2024;165(12):2679-2692. Abstract source only. Link
- Wertli MM, Rasmussen-Barr E, Held U, Weiser S, Bachmann LM, Brunner F. Fear-avoidance beliefs—a moderator of treatment efficacy in patients with low back pain: a systematic review. Spine J. 2014;14(11):2658-2678. Abstract source only. Link
- Lin I, Wiles L, Waller R, et al. What does best practice care for musculoskeletal pain look like? Eleven consistent recommendations from high-quality clinical practice guidelines: systematic review. Br J Sports Med. 2020;54(2):79-86. Abstract source only. Link
- National Institute for Health and Care Excellence. Low back pain and sciatica in over 16s: assessment and management (NG59). Recommendations 1.1.2, 1.1.3, 1.2.13, 1.2.14 and 1.3.7; last updated 29 July 2026. Full page. Link
- Jaeschke R, Guyatt GH, Sackett DL. Users’ guides to the medical literature. III. How to use an article about a diagnostic test. B. What are the results and will they help me in caring for my patients? JAMA. 1994;271(9):703-707. Abstract source only. Link
Red flags by region: Neck · Shoulder · Elbow · Wrist and hand · Thoracic spine and chest wall · Low back and pelvis · Hip and groin · Knee · Ankle and foot
One study, one test, once a month
Rule It In is a free evidence letter for musculoskeletal clinicians: one recent study explained, one examination test with its real numbers. From Trokos, publisher of Rule It In, Rule It Out.
Free when you confirm your email: a one-page PDF of the strongest special tests to rule in and rule out, with tests that carry a caution flagged separately.
Launch offer for subscribers: the PDF edition of Rule It In, Rule It Out for A$39 instead of A$49, for the first two weeks after publication. Sign up free to get the code on launch day.
By subscribing you agree to receive Rule It In by email, about once a month. You will get a confirmation email first, and nothing is sent until you click it. Your address is stored by Kit (Kit.com, United States) and used only for this newsletter and the subscriber launch offer; Kit records which issues are opened and which links are clicked. Unsubscribe with one click in any issue. Privacy.