
Special tests library › Glossary
Glossary: sensitivity, specificity, likelihood ratios and other terms
What the figures on these pages mean, in plain words, with one worked example carried through.
Last updated 30 October 2026.
SensitivitySpecificityTrue and false resultsLikelihood ratiosPre-test probabilityPost-test probabilitySpPIn and SnNOutConfidence intervalsExaminer agreement and kappaTest clusters
The worked example
Most of the terms below are explained with the same imaginary test for a rotator cuff tear: it is positive in 80 of 100 people who have a tear, and negative in 90 of 100 people who do not. The same example is used at the front of Rule It In, Rule It Out.
Sensitivity
Of the people who have the condition, the proportion in whom the test is positive. If 100 people have a rotator cuff tear and the test is positive in 80 of them, its sensitivity is 80%.
A test with high sensitivity rarely misses the condition, so a negative result usually helps to rule it out, provided its specificity is not very low; the LR− shows how much. Every test page with accuracy figures gives the sensitivity from its cited study, for example the empty can test.
Specificity
Of the people who do not have the condition, the proportion in whom the test is negative. If 100 people do not have a tear and the test is negative in 90 of them, its specificity is 90%.
A test with high specificity rarely gives a false alarm, so a positive result usually helps to rule the condition in, provided its sensitivity is not very low; the LR+ shows how much.
True and false positives and negatives
Every result falls into one of four groups. A true positive is a positive result in someone who has the condition, and a false positive a positive result in someone who does not. A true negative is a negative result in someone without the condition, and a false negative a negative result in someone who has it. For the example test, in 100 people with a tear and 100 without:
| Has a tear (100) | No tear (100) | |
|---|---|---|
| Test positive | 80 true positives | 10 false positives |
| Test negative | 20 false negatives | 90 true negatives |
Sensitivity is read down the first column (80 of 100) and specificity down the second (90 of 100). Where a study gives these four counts but no confidence intervals, the intervals in the test page's Study details panel are calculated from the counts; see Methods.
Likelihood ratio (LR+ and LR−)
How many times more likely a given result is in a person with the condition than in a person without it. It combines sensitivity and specificity into one figure that shows how far the result should change your estimate.
Positive likelihood ratio (LR+) applies to a positive result. In the example, a positive result occurs in 80% of people with a tear and in 10% of people without one, so the LR+ is 80 ÷ 10 = 8.
Negative likelihood ratio (LR−) applies to a negative result. A negative result occurs in 20% of people with a tear and in 90% of people without one, so the LR− is 20 ÷ 90, or about 0.22.
An LR of 1 changes nothing; the further above 1 an LR+ lies, and the further below 1 an LR− lies, the larger the change. Above about 5 and below about 0.2 a test is doing real work. Between 2 and 0.5 it is barely worth the time (Jaeschke 1994). By those cut-offs, the example test's positive result (8) is doing real work, and its negative result (0.22) falls just short. The verdict on each test page uses the same cut-offs (see How to read these pages), and the strongest tests page lists those whose cited study reports an LR+ of 10 or more or an LR− of 0.1 or less, with no caution on their page.
In general: LR+ = sensitivity ÷ (1 − specificity), and LR− = (1 − sensitivity) ÷ specificity. Where a study publishes its own likelihood ratios, the test page shows those and says as published; they can differ slightly from a ratio worked out from the rounded sensitivity and specificity.
Pre-test probability (the starting probability)
Your estimate, before the test, of how likely the condition is. It comes from how common the condition is in your setting (its prevalence) and from the history. Every test result is applied to this starting figure, so the same result means different things in different clinics.
For example, a full-thickness supraspinatus tear was found on ultrasound in about 5% of people with new shoulder pain seen in primary care in New Zealand (Cadogan 2011), but a full-thickness rotator cuff tear was found in about a third of people aged 40 or over with an acute shoulder injury and a normal X-ray, seen at an emergency and walk-in clinic in Oslo (Enger 2025). Published starting figures by setting are on the How common is it? page.
Post-test probability (what the result does to the chance)
Your revised estimate once the result is known. A likelihood ratio acts on the odds rather than directly on the probability, so there are three steps: turn the starting probability into odds, multiply the odds by the likelihood ratio, and turn the new odds back into a probability.
With the example test, suppose you start at 30%. A 30% chance is odds of 30 to 70, or about 0.43. A positive result (LR+ 8) multiplies those odds by 8, to about 3.4, which is a chance of 3.4 in 4.4, or about 77%. A negative result (LR− 0.22) multiplies them by 0.22, to about 0.095, which is a chance of about 9%.
Each test page with usable likelihood ratios shows the result from starting points of 10%, 30% and 50%, and the probability calculator does the calculation for any starting estimate.
SpPIn and SnNOut
Two long-standing teaching mnemonics. SpPIn: when a test has a high specificity, a positive result rules the condition in. SnNOut: when a test has a high sensitivity, a negative result rules it out.
They are most dependable when the other measure is also reasonably high; when it is low, they can mislead. For example, a test that is negative in 95 of 100 people without the condition (specificity 95%) but positive in only 5 of 100 people with it (sensitivity 5%) has an LR+ of 5 ÷ 5 = 1: despite its high specificity, a positive result changes nothing. Because the likelihood ratio takes both measures into account, it is the safer guide (Pewsner 2004).
Confidence interval (95% CI)
The range within which the true value is likely to lie, given the size of the study. A wide interval, which is usual in small studies, means the headline figure is far less certain than it looks. The interval reflects chance only, not flaws in how the study was done.
For example, in a study of 249 patients, three or more of five findings for cervical myelopathy gave an LR+ of 30.9, but the 95% confidence interval ran from 5.5 to 181.8 (Cook 2010; abstract source only): the true LR+ could be much lower. Where they are available, each test page gives its confidence intervals in the Study details panel, and Methods explains how they were obtained.
Examiner agreement (reliability) and kappa
Reliability is how often two examiners (inter-examiner), or one examiner on two occasions (intra-examiner), reach the same result in the same patient. It is separate from accuracy: a test can be accurate in the hands of the examiners who developed it and still give different results in different hands.
Kappa (κ) measures how far two examiners agree on a positive or negative result beyond the agreement expected by chance alone. A kappa of 1 means complete agreement, 0 means no better than chance, and a negative value means worse than chance. The agreement lines on these pages use the descriptive bands of Landis and Koch (1977), which are a convention rather than a rule:
| Kappa | Agreement |
|---|---|
| below 0 | Poor |
| 0 to 0.20 | Slight |
| 0.21 to 0.40 | Fair |
| 0.41 to 0.60 | Moderate |
| 0.61 to 0.80 | Substantial |
| 0.81 to 1.00 | Almost perfect |
For example, the empty can test page reports kappa of 0.72 to 0.94 between examiners across two studies: substantial to almost perfect agreement. A third, smaller study reported lower figures (see the test page). Kappa can be low even when examiners usually agree if nearly all the patients in a study are positive, or nearly all negative. For a measurement or a score on a scale, agreement is usually reported as an intraclass correlation coefficient (ICC) instead; the two are not interchangeable.
Test cluster (combination)
Two or more findings tested together as a set in the same patients, with their combined result reported, usually as how many of the set were positive. For example, Wainner and colleagues (2003) studied four findings together for cervical radiculopathy (the upper limb tension test, neck rotation of less than 60° towards the painful side, symptoms eased by neck distraction, and Spurling's test) and reported the result with three, and with all four, positive.
Tests for the same problem are rarely independent. Lachman and the anterior drawer both measure the same forward movement of the tibia, so a second positive adds much less than its own figure suggests. The only valid figure for a combination is the one a study reports for that combination, and no figure on this site is worked out by multiplying the figures for single tests. Published clusters are gathered on the studied combinations page.
References
Cadogan A, Laslett M, Hing WA, McNair PJ, Coates MH. A prospective study of shoulder pain in primary care: prevalence of imaged pathology and response to guided diagnostic blocks. BMC Musculoskelet Disord. 2011;12:119.
Cook C, Brown C, Isaacs R, Roman M, Davis S, Richardson W. Clustered clinical findings for diagnosis of cervical spine myelopathy. J Man Manip Ther. 2010;18(4):175–180.
Enger M, Schmidt M, Nordsletten L, Moosmayer S, Pripp AH, Melhuus K, Brox JI. Physical examination tests in the acute phase of shoulder injuries with negative radiographs: a diagnostic accuracy study. BMC Musculoskelet Disord. 2025;26(1):546.
Jaeschke R, Guyatt GH, Sackett DL. Users' guides to the medical literature. III. How to use an article about a diagnostic test. B. What are the results and will they help me in caring for my patients? JAMA. 1994;271(9):703–707.
Landis JR, Koch GG. The measurement of observer agreement for categorical data. Biometrics. 1977;33(1):159–174.
Pewsner D, Battaglia M, Minder C, Marx A, Bucher HC, Egger M. Ruling a diagnosis in or out with “SpPIn” and “SnNOut”: a note of caution. BMJ. 2004;329(7459):209–213.
Wainner RS, Fritz JM, Irrgang JJ, Boninger ML, Delitto A, Allison S. Reliability and diagnostic accuracy of the clinical examination and patient self-report measures for cervical radiculopathy. Spine. 2003;28(1):52–62.
The empty can agreement figures are cited in full, with their studies, on the empty can test page. See also Methods and How this library is made.
How to cite
Citing a figure? Cite the study it comes from. The studies quoted on this page are listed under References.
Citing this page:
APA 7: Tompson, S. (2026, October 30). Glossary: sensitivity, specificity, likelihood ratios and other terms. Trokos special tests library. Retrieved October 30, 2026, from https://trokos.com.au/tests/glossary.html
Vancouver: Tompson S. Glossary: sensitivity, specificity, likelihood ratios and other terms [Internet]. Sunshine Coast (QLD): Trokos; 2026 [updated 2026 Oct 30; cited 2026 Oct 30]. Available from: https://trokos.com.au/tests/glossary.html
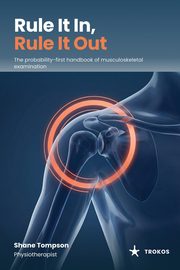
Get the book for these terms in use, test by test
The front of Rule It In, Rule It Out works through the same example, and its glossary defines the terms the book uses. Every test with usable figures has a ready-made ladder (the probability after a positive and a negative from 10%, 30% and 50%), with a nomogram for the numbers in between.
Coming November 2026: 330 pages, paperback and PDF. Launch offer: subscribers get the PDF for A$39 instead of A$49, for the first two weeks after publication. Be first to know at launch
One study, one test, once a month
Rule It In is a free evidence letter for musculoskeletal clinicians: one recent study explained, one examination test with its real numbers. From Trokos, publisher of Rule It In, Rule It Out.
Free when you confirm your email: a one-page PDF of the strongest special tests to rule in and rule out, with tests that carry a caution flagged separately.
Launch offer for subscribers: the PDF edition of Rule It In, Rule It Out for A$39 instead of A$49, for the first two weeks after publication. Sign up free to get the code on launch day.
By subscribing you agree to receive Rule It In by email, about once a month. You will get a confirmation email first, and nothing is sent until you click it. Your address is stored by Kit (Kit.com, United States) and used only for this newsletter and the subscriber launch offer; Kit records which issues are opened and which links are clicked. Unsubscribe with one click in any issue. Privacy.